> ## Documentation Index
> Fetch the complete documentation index at: https://hc.saas-manager.biz.nuro.jp/llms.txt
> Use this file to discover all available pages before exploring further.
# 3. Check Service Usage in Event Log
> Learn how to view service access history using the event log.
#### Checking Service Access Status
The following methods are available to check service access logs.
1. **Access status via Google login**.
If you have integrated Google Workspace, you can view access status for services accessed using Google login. See [Shadow IT Detection via Google Workspace (Details)](/en/it-management/shadow-it/8nwq5urwh5-shadow-it) for more information.
2. **Access status via Microsoft 365 / Microsoft Entra ID**.
This requires integrating Microsoft 365 / Microsoft Entra ID using an account with an Entra ID Premium P1/P2 license. Once integrated, you can view access history for services accessed through Microsoft 365 / Microsoft Entra ID login.
3. **Access status via browser extension**
You can view access status from browsers with the extension installed. For details, see [Distribute the Browser Extension to Detect Shadow IT](/en/it-management/shadow-it/7q1wryx3dk-extension).
#### Viewing the Event Log
Navigate to **Integration** > **Event Log**. You can filter by service name or email address.
 | | Column | Description |
| - | ------------------ | ------------------------------------------------------------------------------------------------------------------------------------------------------------------------------------------------------------------------------------------------------------------------------------------------------------------------------------------------------------------------------------------------------------------------------------------------------------------------------------------------------------------------------------------------------------------------------------------ |
| ① | **Date range** | The default range is 1 month. You can view up to 1 year of logs. |
| ② | **Show unmatched** | Check "Show unmatched" to display event logs that have not been matched to a known service. |
| ③ | **Export** | You can export two types of reports. Click \[**Export**] > select the format.
| | Column | Description |
| - | ------------------ | ------------------------------------------------------------------------------------------------------------------------------------------------------------------------------------------------------------------------------------------------------------------------------------------------------------------------------------------------------------------------------------------------------------------------------------------------------------------------------------------------------------------------------------------------------------------------------------------ |
| ① | **Date range** | The default range is 1 month. You can view up to 1 year of logs. |
| ② | **Show unmatched** | Check "Show unmatched" to display event logs that have not been matched to a known service. |
| ③ | **Export** | You can export two types of reports. Click \[**Export**] > select the format.
**·** [Raw data (CSV)](#csv)
**·** [Monthly summary (XLSX)](#xlsx) |
| ④ | **Service name** | Displays the name of the detected service. |
| ⑤ | **Event name** | Displays events such as Authorize and Revoke. |
| ⑥ | **Date/time** | Displays the detection date and time. Shown in UTC (Coordinated Universal Time). |
| ⑦ | **Email / UUID** | Displays the email address and \*UUID of the user who accessed the service. \*UUID appears when no email address is configured in the extension. For how to look up UUIDs and configure email addresses, see the links below.
- {/* TODO(broken-link): /it-management/shadow-it/g79d7sh5vv-chrome-gp#1354790070 */}For Google Chrome
- {/* TODO(broken-link): /it-management/shadow-it/mx29fwcey8-edge#2926788529 */}For Microsoft Edge |
| ⑧ | **Domain** | Displays the domain detected by the extension. |
| ⑨ | **Source** | Displays the detection source. For details, see the **Main Shadow IT Detection Methods** section in [0. From Setup to Shadow IT Detection](/en/it-management/shadow-it/w4xowrirdb-it#detection-methods).
- Google Auth (Google login)
- Microsoft Auth (Microsoft 365 / Microsoft Entra ID)
- `Browser` Extension
※ Retrieving the source "Microsoft OAuth" requires an Entra ID Premium P1 or P2 license. ([Reference](https://learn.microsoft.com/en-us/troubleshoot/entra/entra-id/users-groups-entra-apis/b2c-or-tenant-premium-license-sign-in-activities)) |
| ⑩ | **Source PC** | If you set an arbitrary text (such as a string identifying the PC) in the registry `UserPC` field, it appears in the "Source PC" column. Examples: hostname, asset number, IP address |
#### Exporting the Event Log
You can export two types of reports from the event log. Click \[**Export**] in the upper right, select the format, and export.
**·** Raw data (CSV)
**·** Monthly summary (XLSX)
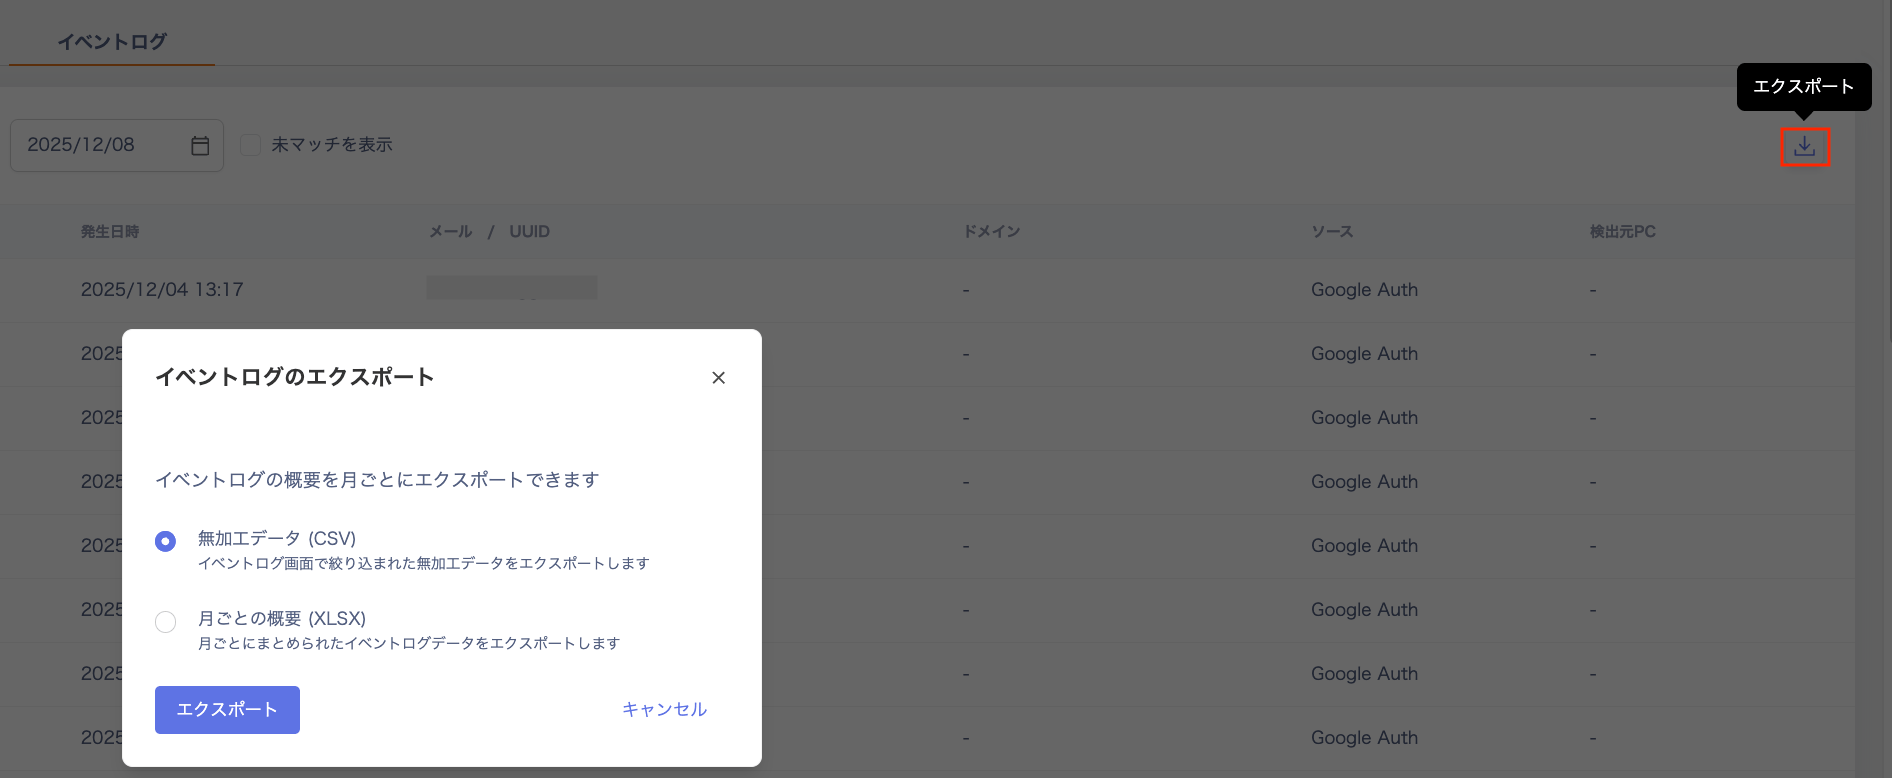
Raw Data (CSV)
Exports the filtered data on the event log page to a CSV file.
| Item | Description |
| ------------------- | ---------------------------------------------- |
| **Output** | The content filtered on screen exports as-is. |
| **Maximum records** | Each export supports up to **20,000 records**. |
| **Maximum period** | You can specify up to **3 months** per export. |
If the period exceeds 3 months or the data exceeds 20,000 records, use the filter to narrow the date range and export in multiple batches.
Summary Report (XLSX)
Exports a monthly aggregated report to an Excel file. You can specify a period of up to 1 year.
The exported data is organized into the following two tabs by month.
* **service tab**
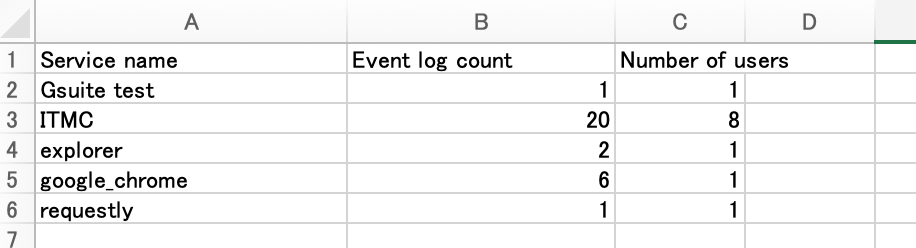 | Column | Description |
| ------------------- | ------------------------------------------------------ |
| **Service name** | The name of the service detected that month. |
| **Event log count** | The total number of records detected in the event log. |
| **Number of users** | The number of users who accessed that service. |
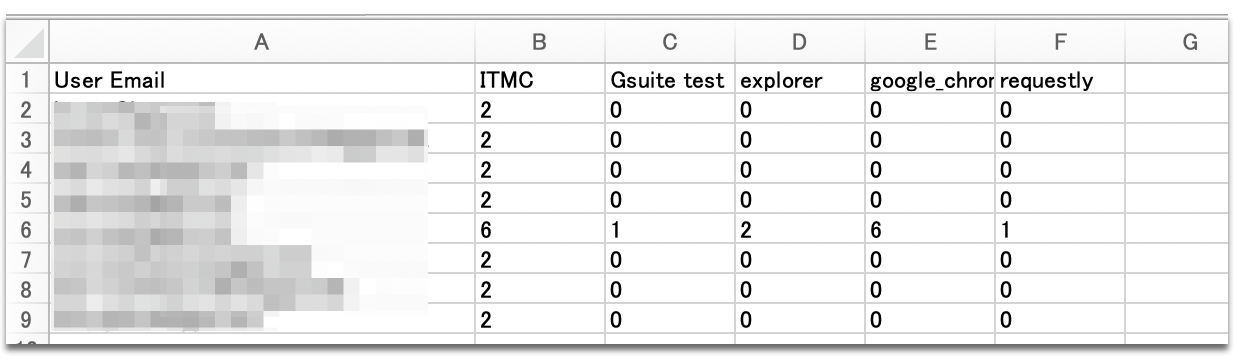
* **service\_email tab**
Displays a matrix showing how many times each user (email address) accessed each service.
| Column | Description |
| ------------------- | ------------------------------------------------------ |
| **Service name** | The name of the service detected that month. |
| **Event log count** | The total number of records detected in the event log. |
| **Number of users** | The number of users who accessed that service. |
* **service\_email tab**
Displays a matrix showing how many times each user (email address) accessed each service.